

Apr 5, 2006 - Ls 34.7 MY 28 to Aug 30, 2006 - Ls 99.6 MY 28

Graphed MGS aerobraking-derived atmospheric density values in 'profile format' obtained from accelerometer measurements during orbit #173 (Ls 292, MY 23). Both 1-second and 40-second average values (and their error bar magnitudes) are displayed. The graphed values are available in the data file available here.
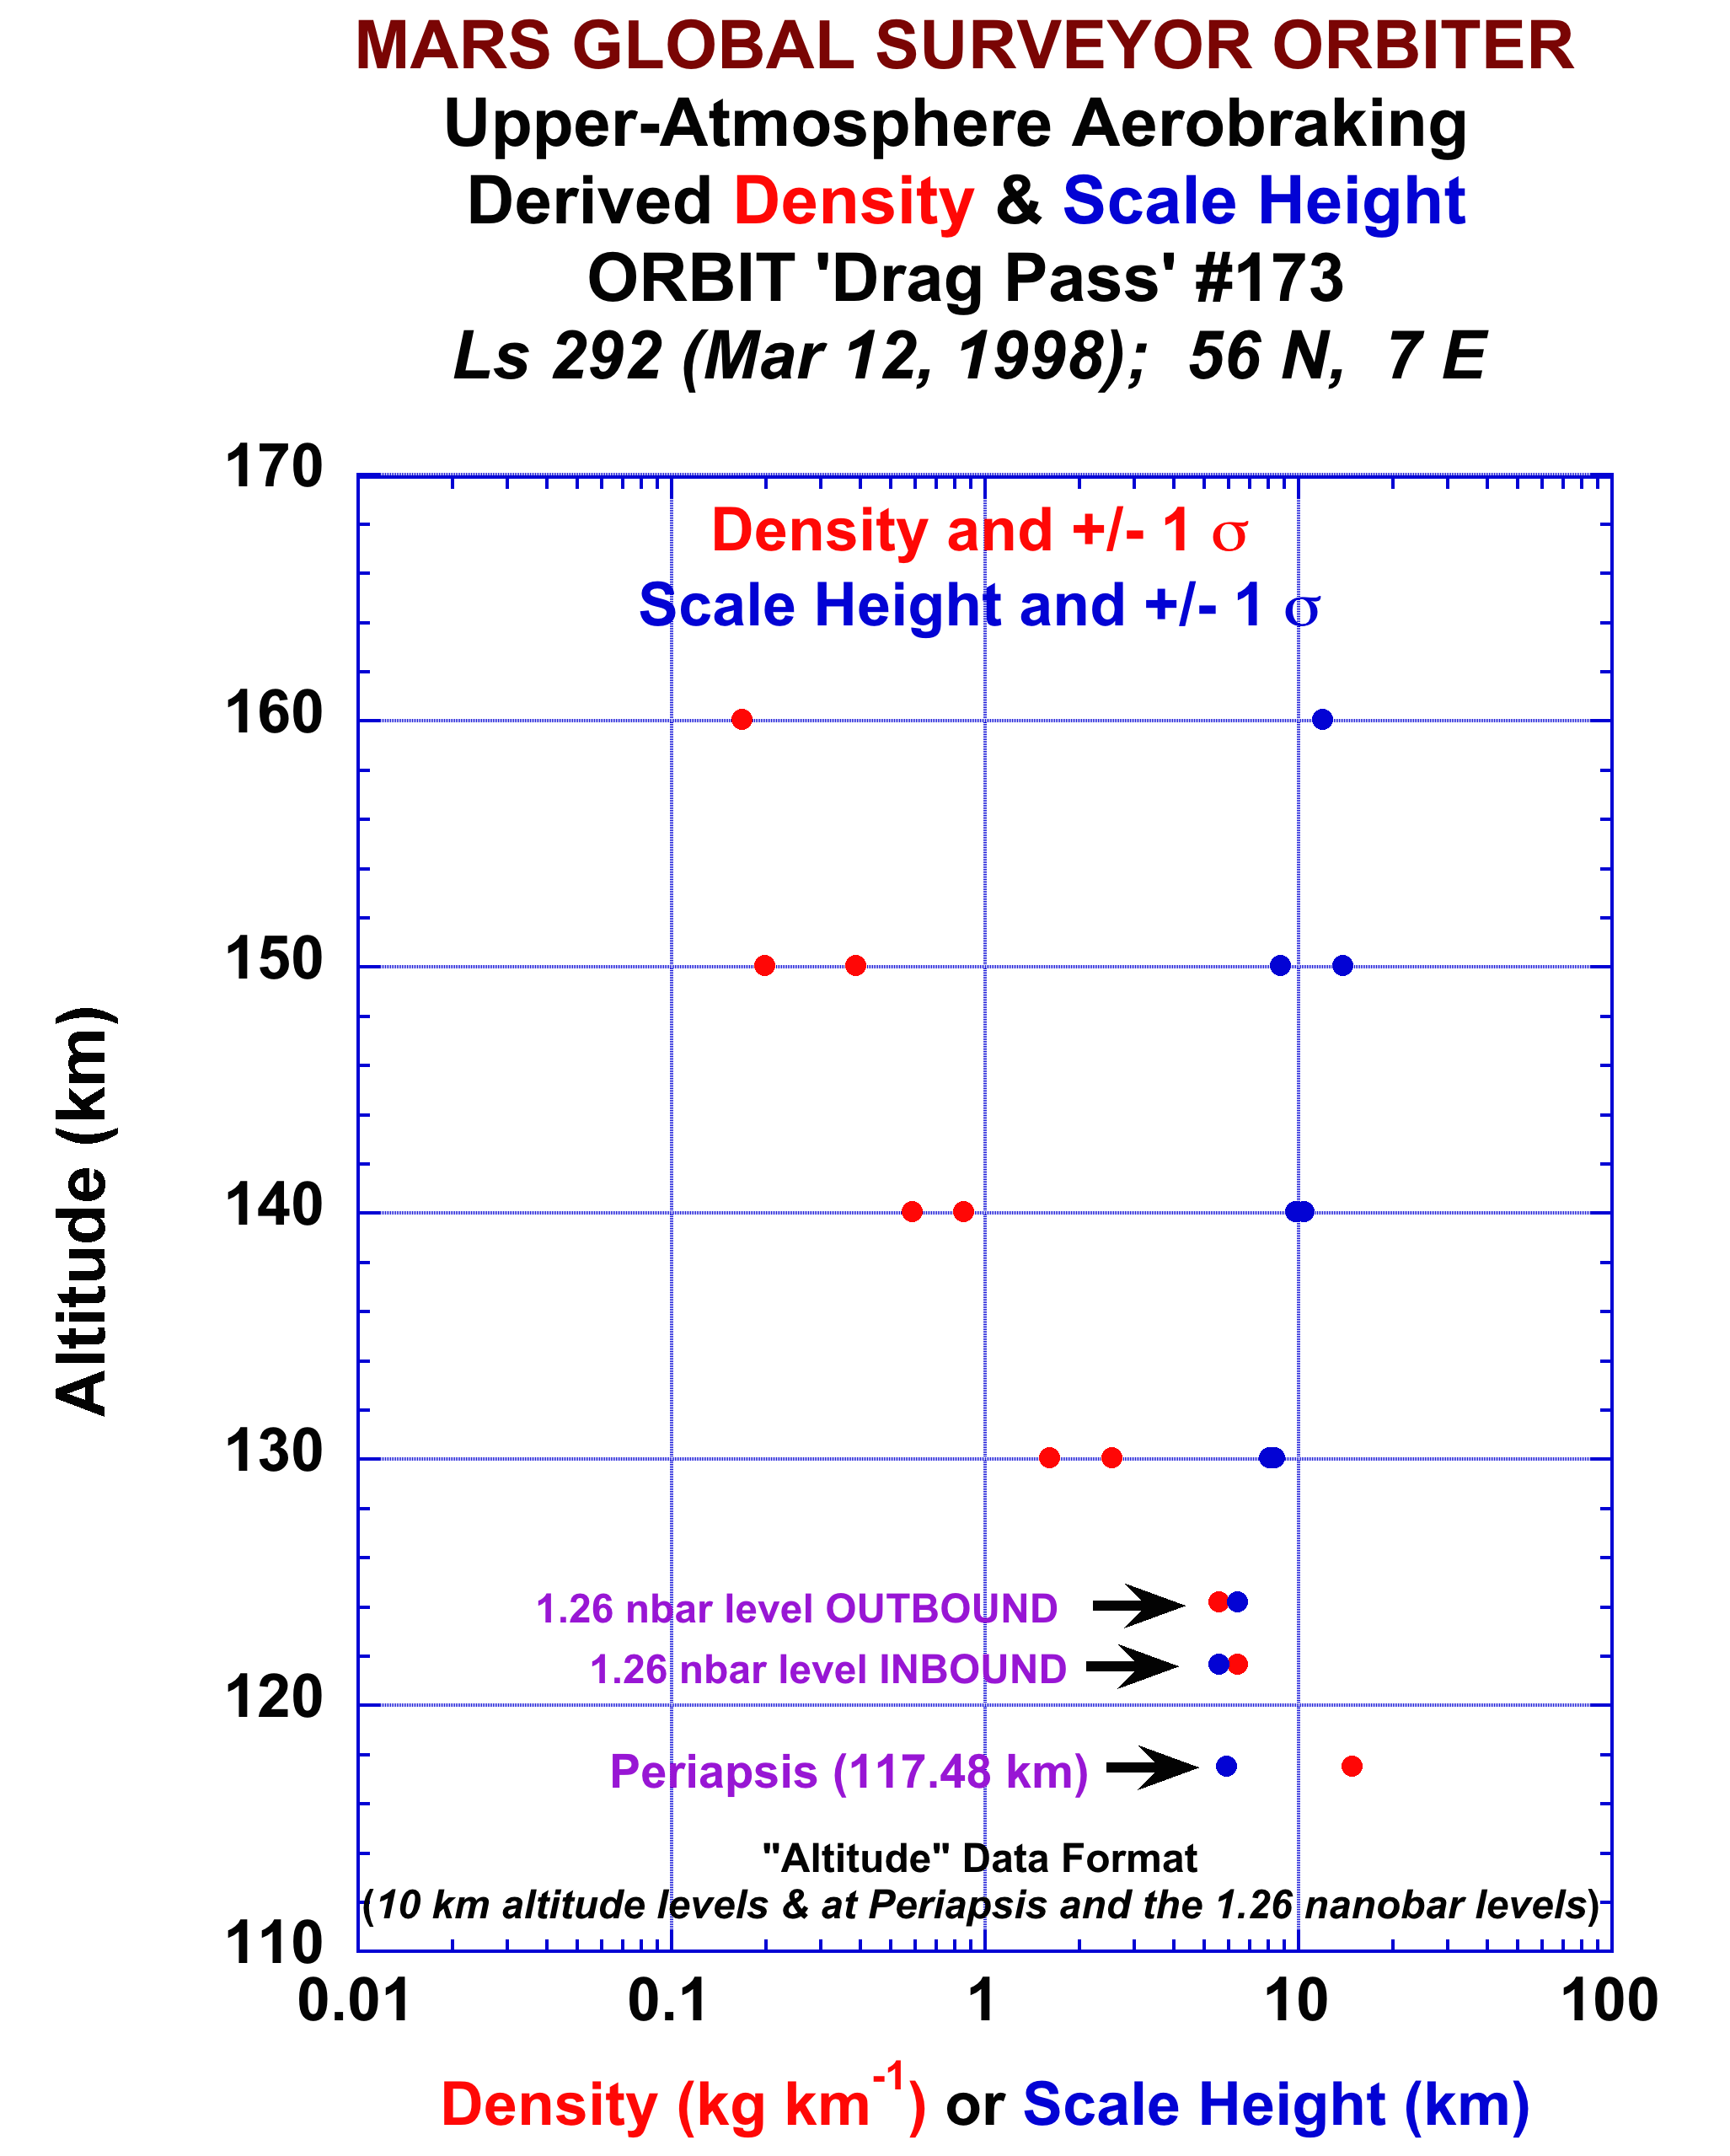
Graphed MGS aerobraking-derived atmospheric density and scale height values in 'altitude format' obtained from accelerometer measurements during orbit #173 (Ls 292, MY 23). The graphed values are available in the data file available here.
Useful Mission Documents
Description of the DATA
For each drag pass (spanning orbits 5 - 1281 of the mission) there is an individual ASCII profile file containing derived density values at 1-second intervals for a time period spanning several hundred seconds centered upon the periapse time. There is also a separate ASCII altitude file which provides derived density and scale height values at specified altitudes (100 km, 110 km, etc.) for both the inbound and outbound portions of the orbit/drag pass as well as at the periapsis altitude, and 1.26 nanobar pressure level during both the inbound and outbound portions of the orbit/drag pass.
The data contained within the MGS aerobraking PDS archive MGSA_0002 are provided in either the altitude or profile folders within the data folder. Within both the profile and altitude folders are subfolders containing ~100 drag passes of data, with each drag pass consisting of a single ASCII file. No drag passes occurred during orbits 19-39 or 203-572 so the archive does not contain files for those orbits.
Retrieving the data volume
Derived Data
Accelerometer Profile data description
Access to data
Accelerometer altitude data description
Access to data
Raw Data
Description of data volume
Mission Description
Spacecraft Description
Instrument Description
Guide to Accelerometer products
Calibration Data
References
Mission Description
Spacecraft Description
Instrument Description
Guide to Accelerometer products
Calibration Data
References
Description of the DATA
For each drag pass (spanning orbits 5 - 1281 of the mission) there is an individual ASCII profile file containing derived density values at 1-second intervals for a time period spanning several hundred seconds centered upon the periapse time. There is also a separate ASCII altitude file which provides derived density and scale height values at specified altitudes (100 km, 110 km, etc.) for both the inbound and outbound portions of the orbit/drag pass as well as at the periapsis altitude, and 1.26 nanobar pressure level during both the inbound and outbound portions of the orbit/drag pass.
The data contained within the MGS aerobraking PDS archive MGSA_0002 are provided in either the altitude or profile folders within the data folder. Within both the profile and altitude folders are subfolders containing ~100 drag passes of data, with each drag pass consisting of a single ASCII file. No drag passes occurred during orbits 19-39 or 203-572 so the archive does not contain files for those orbits.
Retrieving the data volume
Derived Data
Accelerometer Profile data description
Access to data
Accelerometer altitude data description
Access to data
Raw Data