On this page
Introduction
Data Acquisition and Structure
Selecting Data
Citing datasets for publication
Bibliography
Spice

Credit JPL/NASA
Introduction
InSight landed on Mars on November 26, 2018. The goal of the mission is to study the deep interior. The primary phase of the mission is scheduled to extend for a little more than a Martian year. The main components of the instrument package are the Seismic Experiment for Interior Structure (SEIS) and the Heat-Flow and Physical Properties Probe (HP3). They are supported by the Auxiliary Payload Sensor Subsystem (APSS), which includes temperature, wind (this page) and pressure sensors (this page) and a magnetometer. A radiometer to measure surface temperature and thermal properties supports HP3. X-band radio science, Rotation and Interior Structure Experiment (RISE), will refine knowledge concerning global structure. The Instrument Deployment Camera (IDC) and the Instrument Context Camera (ICC) provide support imaging.
The fact that the InSight instrument ensemble contains a highly sensitive pressure sensor (PS), and temperature and wind detectors (TWINS), combined with the radiometer (RAD) instrument, which will measure the surface brightness temperature, and a camera with multiple filters (IDC), which can be used to quantify atmospheric opacity, provides the components for an effective weather station. This weather station provides a more continuous and higher-frequency record of pressure, air temperature and winds at the surface of Mars than previous in situ missions.
References
Spiga, A., Banfield, D., Teanby, N.A. et al. Atmospheric Science with InSIght, Space Sci Rev (2018) 214: 109. https://doi.org/10.1007/s11214-018-0543-0
Banfield,D., et al., InSight Auxiliary Payload Sensor Suite (APSS), Space Sci Rev (2019) 215: 4. https://doi.org/10.1007/s11214-018-0570-x
Instrument Description
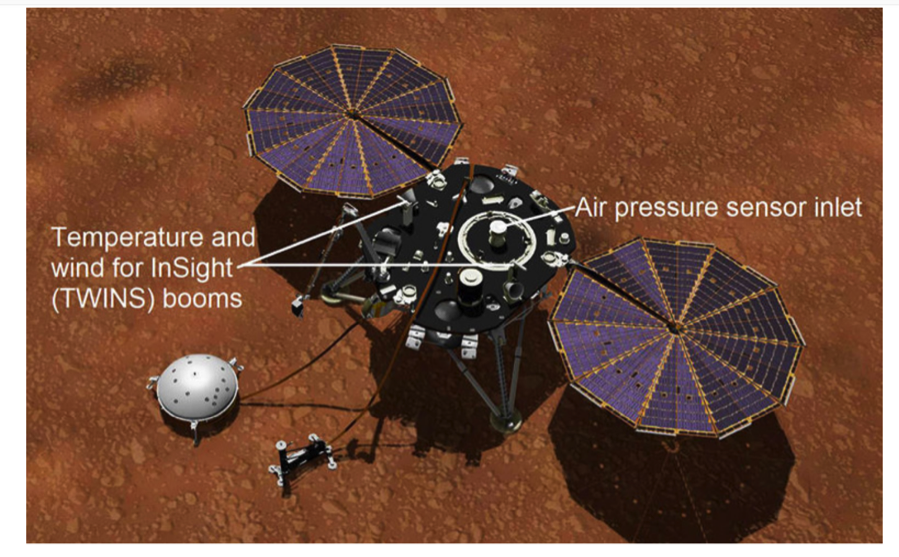
The Temperature and Wind for InSight (TWINS) instrument and Pressure Sensor (PS) are part of the APSS. Data from both TWINS and PS will be used by SEIS to reduce and decorrelate atmospheric effects from seismic signals.TWINS is comprised of two identical booms arrayed with wind and temperature sensors that are placed on diametrically opposite sides of the lander deck, one pointing in the -Y lander axis direction and the other in the +Y direction. The booms are approximately 1.4m above the ground level, 200mm above the lander top deck, horizontally placed, and in parallel to each other. See the software specifications document (pdf) Section 2.6.1.
PS is a pressure transducer located in the lander body, and connected to the ambient atmosphere with an inlet on the lander top deck. See the software specifications document (pdf) Section 2.6.2.

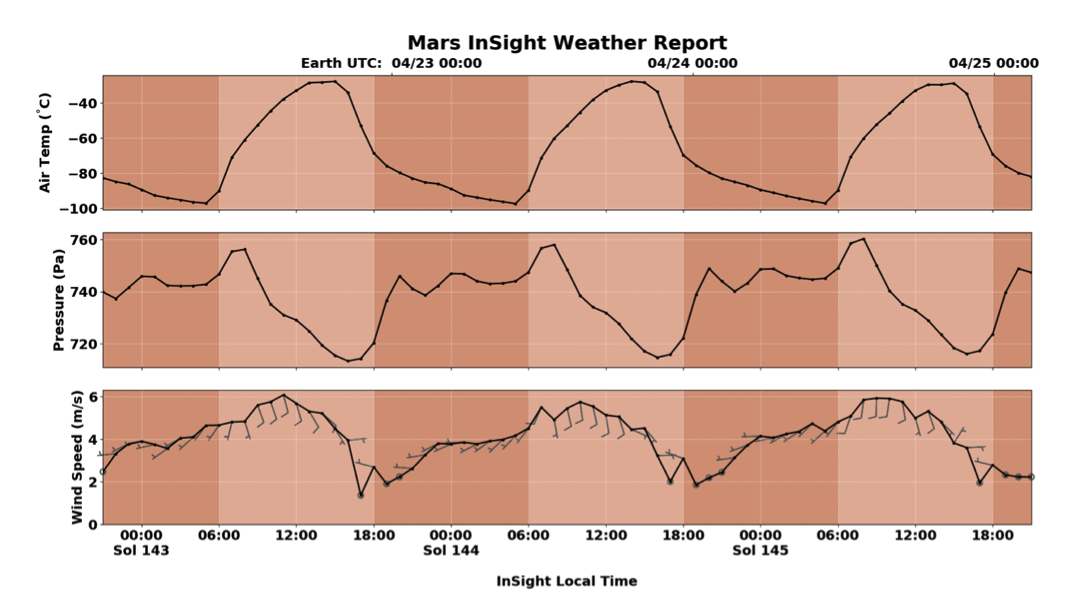
An Example of TWINS and PS Data. The barbs extending from each wind speed data point indicate the compass direction of the wind, with each half flag representing approximately 2.5 meters per second. A circle in place of a barb indicates a wind speed less than 2.5 meters per second. Credit: NASA/JPL-Caltech/Cornell/CAB
Data Acquisition
Twins
During the deployment phase TWINS provided data regarding temperature and wind speed and direction, with the objective of assessing when to deploy instruments. Both booms were used, limited by available resources.
Continuous logging is the main driver for TWINS operation. Available transmission bandwidth per sol will dictate what portion of the recorded data can be downloaded to Earth. Two retrieval modes are defined: event retrieval mode. (high sampling rate) and continuous mode. In continuous mode, only selected, low frequency data are sent. So far, during the science-monitoring phase, both booms have been used and as long as the earlier downlink rate is available this will be the case. The continuous mode will be sampled less, both booms will be used and the continuous mode will be the dominant mode of operation.
Event retrieval is very dependent of available downlink bandwidth, and most of the data will be in continuous mode.
Table 1 summarizes downlink modes. So far as of May 2019, available downlink has allowed the event retrieval mode to be the dominate mode.
| Downlink Mode | Wind speed data retrieval | Air Temperature data retrieval | Additional |
|---|---|---|---|
| Continuous | 1/M Hz | N samples average and standard deviation at 1/M Hz | M*=decimation rate=20, 10, 2, 1 N**=average window=7 |
| Event/Full | 1 Hz, 0.5Hz, 02.Hz | 1 Hz, 0.5Hz, 0.2Hz |
*For nominal operations, M is set to 10. Since TWINS has a sampling rate of 1Hz, this makes an effective frequency of 0.1Hz.
**a running average and standard deviation of the last N samples is transmitted
PS
Because the pressure decorrelation is crucial to interpreting the seismic signals, pressure data are needed at all times of the mission, the pressure sensor is designed to operate constantly throughout the mission, only being turned off in case of low power availability. The native sampling rate on board the lander is 20 Hz, but is downsampled to a lower rate continuous data stream. For the nominal downlink case (continuous mode, ~38 Mbits/Sol), the pressure sensor will return continuous data downsampled to 2 Hz, and its temperature sensor will be downsampled to 0.2 Hz. There will be a certain amount of the downlink budget allocated to “events” which will be special times in the mission where anomalous signals are detected in the pressure (or seismic or wind or magnetic) data sets, and full temporal resolution data sets are desired. In this case, a higher rate data set from the pressure sensor will be downlinked.Pressure Sensor continuous and event modes data rates may change during the mission. Table 2 summarizes rates defined at the writing of this document.
| Downlink Mode | Pressure data retrieval | Temperature data retrieval | Additional |
|---|---|---|---|
| Continuous | 2 Hz, 10 Hz | 0.2 Hz | RMS of >1Hz@0.5 Hz or 1Hz |
| Event | 10 Hz, 5Hz, 4Hz | 10 Hz, 5Hz, 4Hz, 2Hz, 1Hz, 0.5Hz | |
| Full | 20 Hz | 20 Hz |
The data products ps_raw and ps_rawevent contain pressure and pressure temperature raw data numbers for continuous and event data, respectively. Pressure is calculated for each datum and is stored in the ps_calib and ps_calibevent files. The conversion from pressure sensor data numbers to calibrated pressure is dependent on the pressure sensor’s temperature, so pressure temperature must be calculated from the raw data numbers first. See Pressure Sensor processing details
Note: 1 SOL = 24 hr 39 min and 35.244 sec.
The indices are sorted on Start Time and contain data acquired at two rates. Within the URN xxxevent designates the higher data rate.
Data Set Description - SIS (pdf)
Twins Data
Calibrated Data
Note: Due to reduction of power to dust on the solar cells and Martian winter data is missing beginning in January (01-16-21 for TWINS and 01-31-21 for PS)
Twins Data
Calibrated Data
Derived Data
Raw Data
PS Data
Calibrated Data
Calibrated Data
Raw Data
Selected data can be retrieved in 2 ways
1) Downloading an index, selecting components and uploading your selection.
Indices that tabulate information associated with each product are available.
Indices that tabulate information associated with each product are available.
a. Select your index
b. Sort and make your selection
c. Upload the URN values from your revised index (note the total uncompressed file size before requesting)
b. Sort and make your selection
c. Upload the URN values from your revised index (note the total uncompressed file size before requesting)
2) Selecting specific parameters
and requesting limited data files
Indexes have been generated to preserve a reviewed body of weather events. It is not suggested that these are the only events of scientific interest but rather that they are a rich subset of what exists in the body of data. The terms ERP and NEMO were retained for historical reasons where ERPs were transmitted at a high data rate while NEMOs of scientific interest were transmitted at the initial low rate.
Downloading annual collections of data
TWINS collection
PS collection
ERP-Collection
Citing datasets for publication
J.A. Rodriguez-Manfredi, et al. (2019), InSight APSS TWINS Data Product Bundle, NASA Planetary Data System, https://doi.org/10.17189/1518950
D. Banfield, et al. (2019), InSight APSS PS Data Product Bundle, NASA Planetary Data System, https://doi.org/10.17189/1518939.
Bibliography - A listing of team members to facilitate literature searches
Spice - Archived SPICE ancillary data providing observation geometry (positions, orientations, instrument pointing, time conversions, etc.) are available from the PDS NAIF Node.
 PDS: The Planetary Atmospheres Node

