
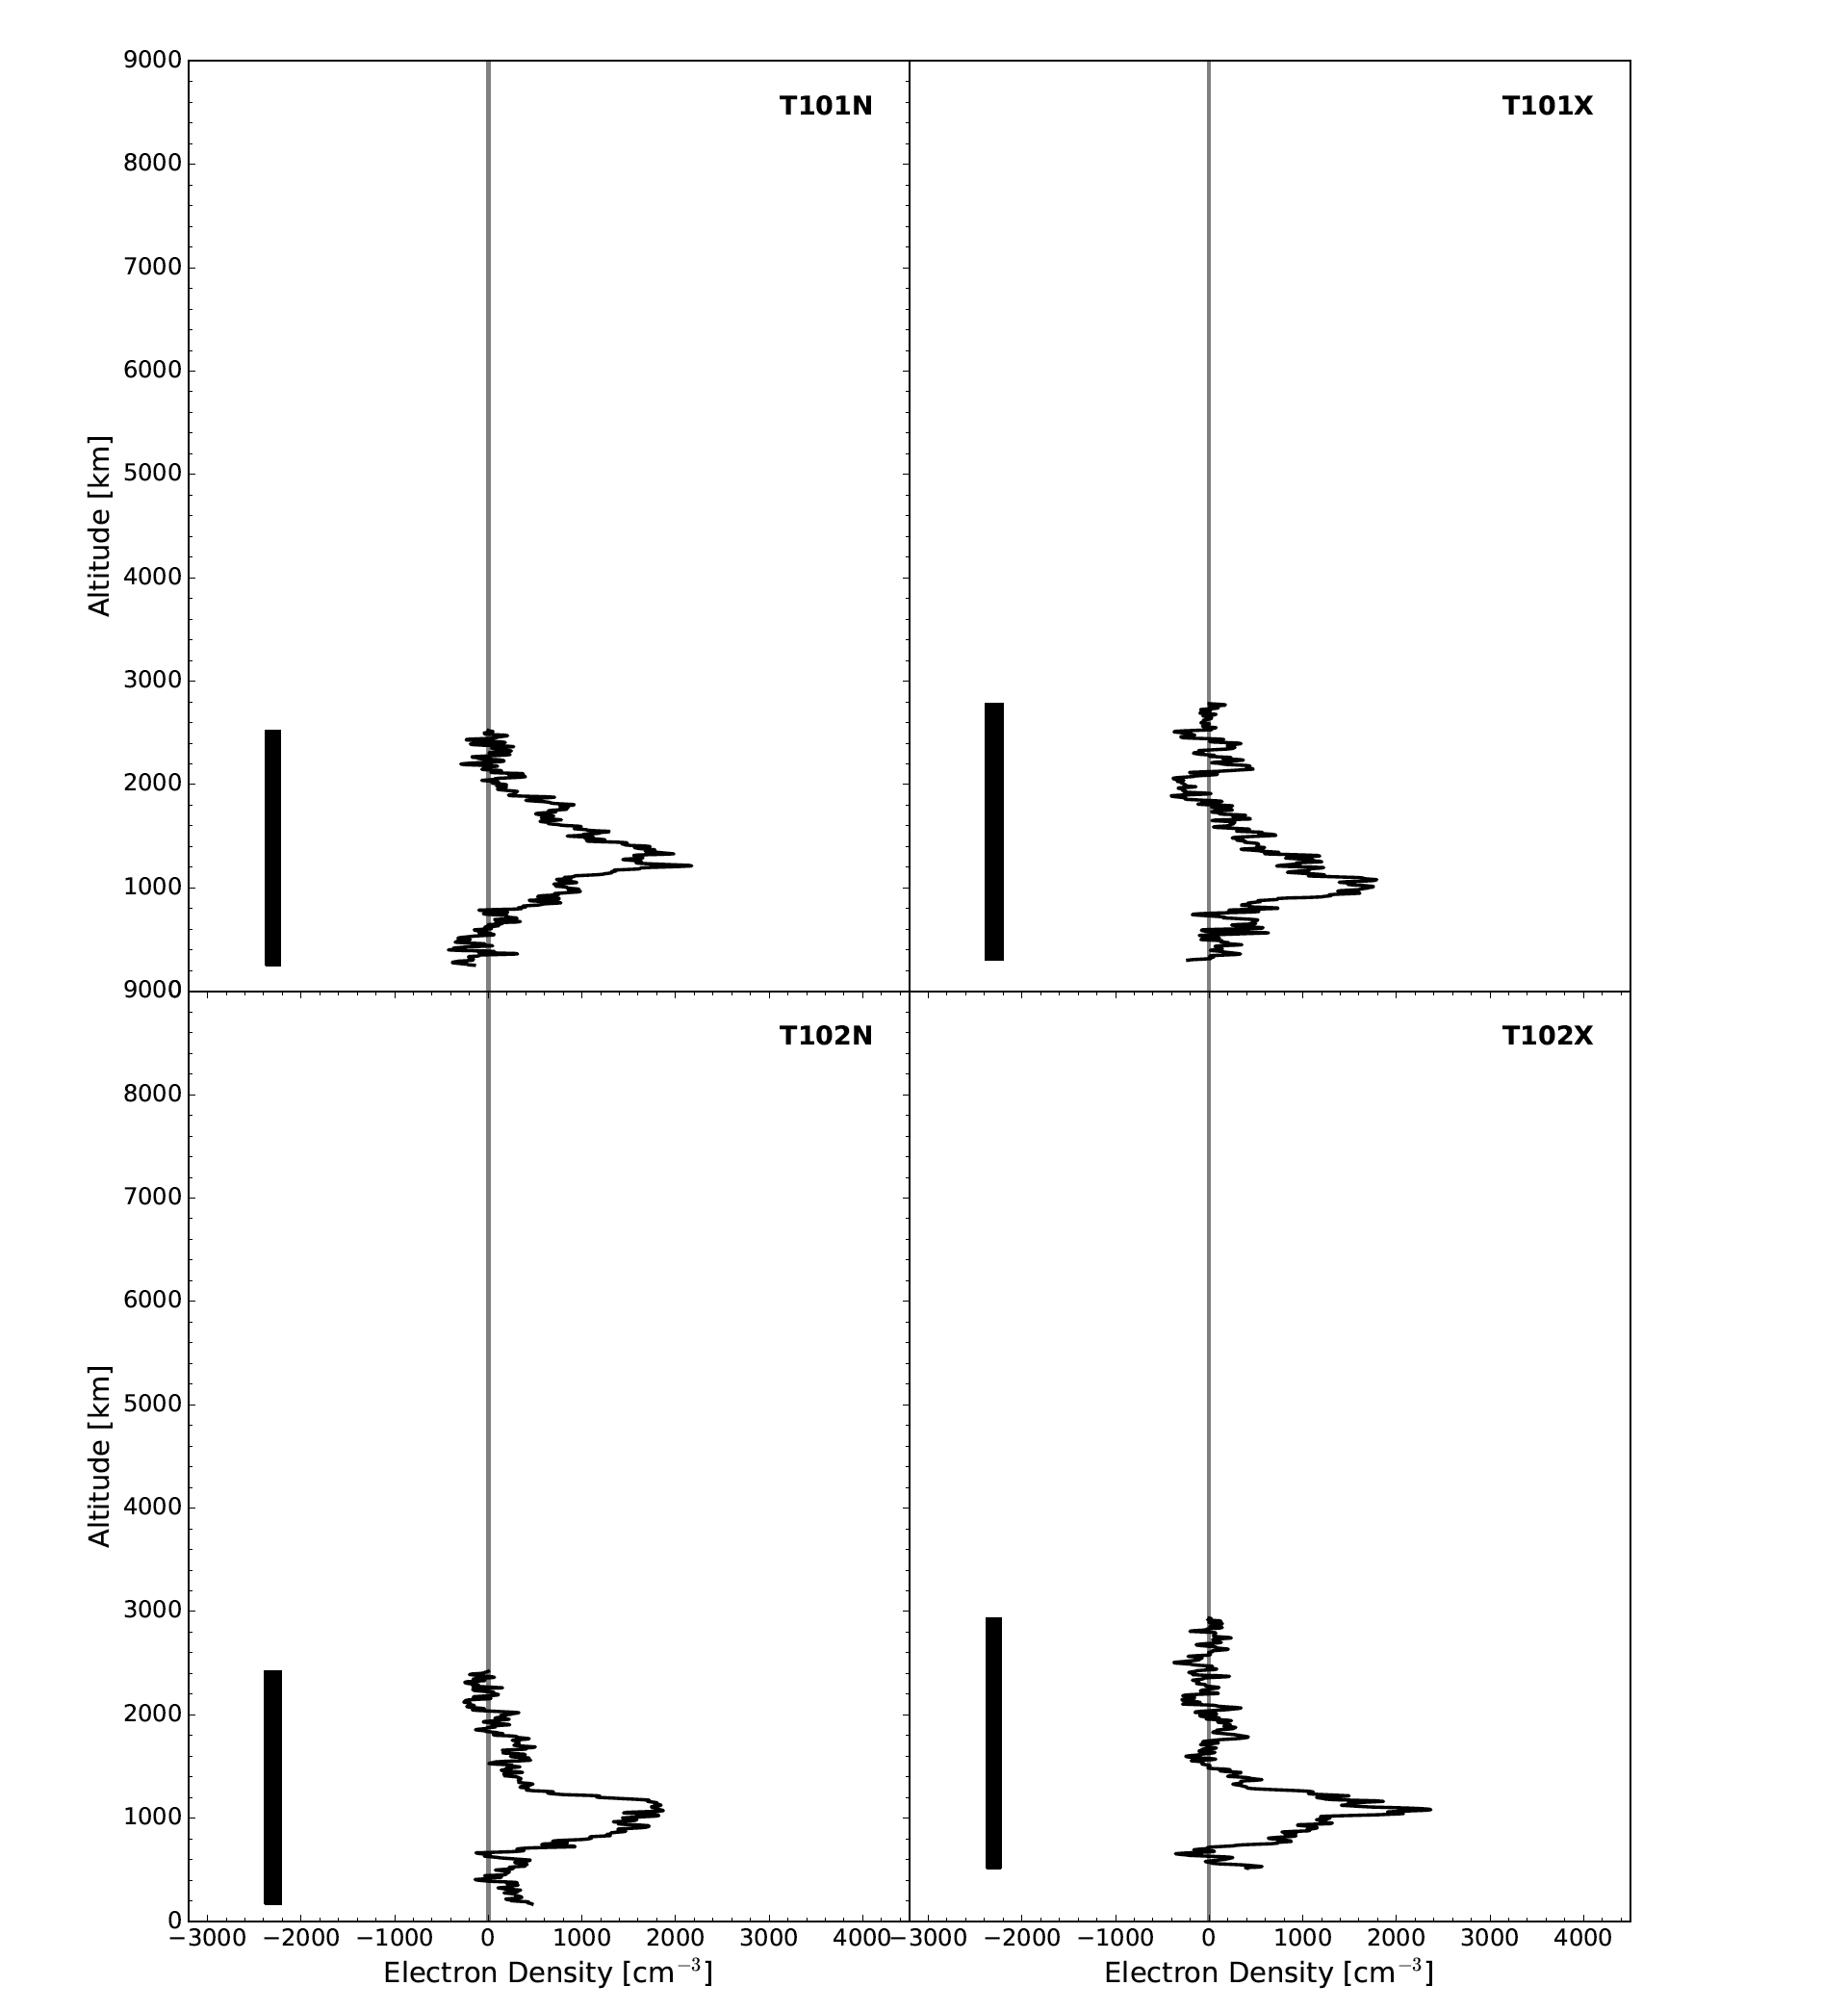
Electron density profiles for occultations T046N, T046X, T052N, and T052X. The black line shows the average profile derived in this work. The width of the vertical bar indicates the 1-σ uncertainty in corresponding electron density profile. The grey vertical line marks zero.
Summary
The aim of this archive is to disseminate ionospheric electron density profiles from Cassini radio occultation observations at Titan. The derived Titan ionospheric electron density profiles and derived time series of received frequency during Titan occultations are included in this archive. On the whole, the main features of the new profiles are generally consistent with the main features of profiles previously reported by Kliore et al. (2008) and Kliore et al. (2011). Specifically, a single layer of plasma with peak density of 1000–3000 cm−3, peak altitude of 1000–1300 km, and full-width at half maximum of a few hundred kilometers.
Derived data products include: (A) time series of the frequency of the radio signal received at Earth during an occultation (freq); (B) individual electron density profiles from occultations (indn); (C) average electron density profiles from occultations (aven); and (D) summary of average electron density profiles (summ). Since each occultation event was observed by multiple Deep Space Network antennas, here an individual electron density profile refers to results based on observations at a single antenna and an average electron density profile refers to the average profile from all available observations of an occultation event.
Reference
Kliore, A. J., etc., (2008), First results from the Cassini radio occultations of the Titan ionosphere, J. Geophys. Res., 113, A09317, doi:10.1029/2007JA012965.
Kliore, A. J., etc., (2011), Unusual electron density profiles observed by Cassini radio occultations in Titan’s ionosphere: Effects of enhanced magnetospheric electron precipitation, J. Geophys. Res., 116, A11318, doi:10.1029/2011JA016694.
Dates and locations are based on ray path with closest approach distance of 3775 km.
N = ingress and X = egress
User's Guide
Accessing the data
Each occultation is specified by a unique identifier (urn). Utilizing these identifiers and the index (CSV) allows retrieval of data at the file level.
Downloading the data
Citing the data
PDS recommendations for citing data sets can be found here .
Withers, P. and L. Huber, (2020), Cassini Orbiter Radio Science Subsystem Occultation and Electron Density Data Archive, PDS Atmospheres (ATM) Node, https://doi.org/10.17189/1518927.
The aim of this archive is to disseminate ionospheric electron density profiles from Cassini radio occultation observations at Titan. The derived Titan ionospheric electron density profiles and derived time series of received frequency during Titan occultations are included in this archive. On the whole, the main features of the new profiles are generally consistent with the main features of profiles previously reported by Kliore et al. (2008) and Kliore et al. (2011). Specifically, a single layer of plasma with peak density of 1000–3000 cm−3, peak altitude of 1000–1300 km, and full-width at half maximum of a few hundred kilometers.
Derived data products include: (A) time series of the frequency of the radio signal received at Earth during an occultation (freq); (B) individual electron density profiles from occultations (indn); (C) average electron density profiles from occultations (aven); and (D) summary of average electron density profiles (summ). Since each occultation event was observed by multiple Deep Space Network antennas, here an individual electron density profile refers to results based on observations at a single antenna and an average electron density profile refers to the average profile from all available observations of an occultation event.
Reference
Kliore, A. J., etc., (2008), First results from the Cassini radio occultations of the Titan ionosphere, J. Geophys. Res., 113, A09317, doi:10.1029/2007JA012965.
Kliore, A. J., etc., (2011), Unusual electron density profiles observed by Cassini radio occultations in Titan’s ionosphere: Effects of enhanced magnetospheric electron precipitation, J. Geophys. Res., 116, A11318, doi:10.1029/2011JA016694.
Summary of Titan electron density profiles
| Occultation | Date (UTC) | Latitude (Deg) | East Longitude (deg) | Solar Zenith Angle (deg) | Local Solar Time (hrs) | Sun-Earth-Cassini Angle (deg) | Earth-Cassini-Sun Angle (deg) | Ram Angle (deg) | Standard Deviation | ||||||||||||||||||||
|---|---|---|---|---|---|---|---|---|---|---|---|---|---|---|---|---|---|---|---|---|---|---|---|---|---|---|---|---|---|
| T012N | 19-Mar-06 | -15 | 162 | 95 | 5.3 | 126 | 5 | 73 | 120 | ||||||||||||||||||||
| T012X | 19-Mar-06 | -35 | 2 | 87.5 | 18.7 | 126 | 5 | 88 | 152 | ||||||||||||||||||||
| T014N | 20-May-06 | -20 | -170 | 95.8 | 5.1 | 67 | 6 | 100 | 180 | ||||||||||||||||||||
| T014X | 20-May-06 | -21 | 25 | 85.8 | 18.1 | 67 | 6 | 66 | 238 | ||||||||||||||||||||
| T027N | 26-Mar-07 | -75 | -138 | 92.2 | 0.6 | 134 | 5 | 94 | 108 | ||||||||||||||||||||
| T027X | 26-Mar-07 | 60 | 90 | 90 | 7.7 | 134 | 5 | 60 | 102 | ||||||||||||||||||||
| T031N | 28-May-07 | -75 | -33 | 92.3 | 23.1 | 72 | 6 | 98 | 212 | ||||||||||||||||||||
| T031X | 28-May-07 | 74 | 126 | 88.2 | 9.8 | 72 | 6 | 77 | 216 | ||||||||||||||||||||
| T046N | 3-Nov-08 | -33 | -60 | 92.3 | 18.4 | 53 | 5 | 137 | 99 | ||||||||||||||||||||
| T046X | 3-Nov-08 | 33 | 119 | 87.8 | 6.4 | 53 | 5 | 43 | 113 | ||||||||||||||||||||
| T052N | 4-Apr-09 | 81 | 97 | 88.1 | 16.3 | 152 | 3 | 81 | 129 | ||||||||||||||||||||
| T052X | 4-Apr-09 | -25 | 121 | 88.4 | 17.9 | 152 | 3 | 39 | 111 | ||||||||||||||||||||
| T057N | 22-Jun-09 | 76 | -46 | 88.6 | 6.5 | 75 | 6 | 100 | 488 | ||||||||||||||||||||
| T101N | 17-May-14 | -53 | -60 | 90.7 | 8 | 172 | 1 | 122 | 149 | ||||||||||||||||||||
| T101X | 17-May-14 | 68 | 175 | 89.6 | 23.7 | 172 | 1 | 88 | 185 | ||||||||||||||||||||
| T102N | 18-Jun-14 | -64 | -39 | 92 | 9.4 | 140 | 4 | 106 | 169 | ||||||||||||||||||||
| T102X | 18-Jun-14 | 64 | 138 | 87.9 | 21.2 | 140 | 4 | 73 | 150 | ||||||||||||||||||||
| T117N | 16-Feb-16 | -37 | 38 | 93.4 | 16.9 | 73 | 5 | 61 | 858 | ||||||||||||||||||||
| T117X | 17-Feb-16 | 53 | 100 | 92.7 | 21.1 | 73 | 5 | 53 | 408 | ||||||||||||||||||||
| T119X | 6-May-16 | 51 | -157 | 88.6 | 3.8 | 152 | 3 | 104 | 204 |
N = ingress and X = egress
User's Guide
Accessing the data
Each occultation is specified by a unique identifier (urn). Utilizing these identifiers and the index (CSV) allows retrieval of data at the file level.
Downloading the data
Citing the data
PDS recommendations for citing data sets can be found here .
Withers, P. and L. Huber, (2020), Cassini Orbiter Radio Science Subsystem Occultation and Electron Density Data Archive, PDS Atmospheres (ATM) Node, https://doi.org/10.17189/1518927.