
On this page
-
Introduction
Jupiter Data
Selecting data
Lunar Observations during Earth Flyby Data
Citing data sets for publication
Bibliography
Spice
Instrument Description
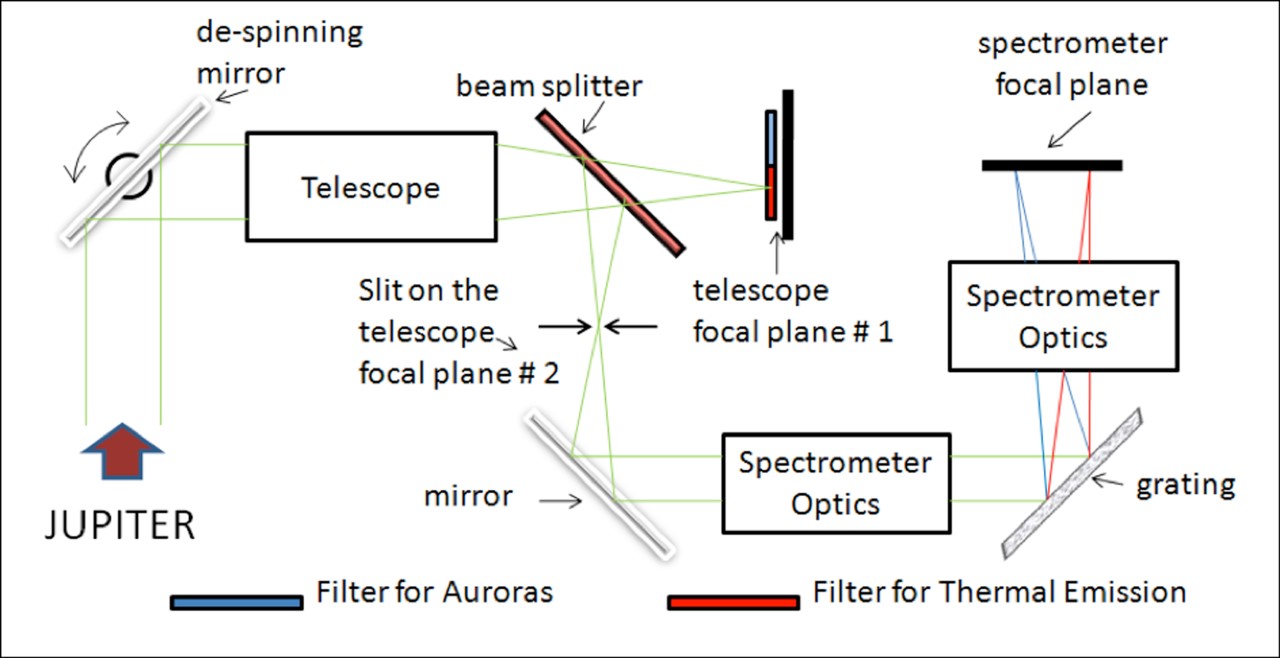
The Jovian InfraRed Auroral Mapper (JIRAM) is a dual instrument, composed of an imager and a spectrometer that share the same telescope. This allows for acquisition of simultaneous imaging and spectral observations. The imager is equipped with L-band (3.45 μm with a 290-nm bandwidth) (for aurora observations) and M-band (4.78 μm with a 480-nm bandwidth) (for observations of thermal emissions) filters. The spectrometer covers a range of 2-5 μm in 336 spectral bins (bands) resulting in a spectral sampling of 8.9 nm per band.
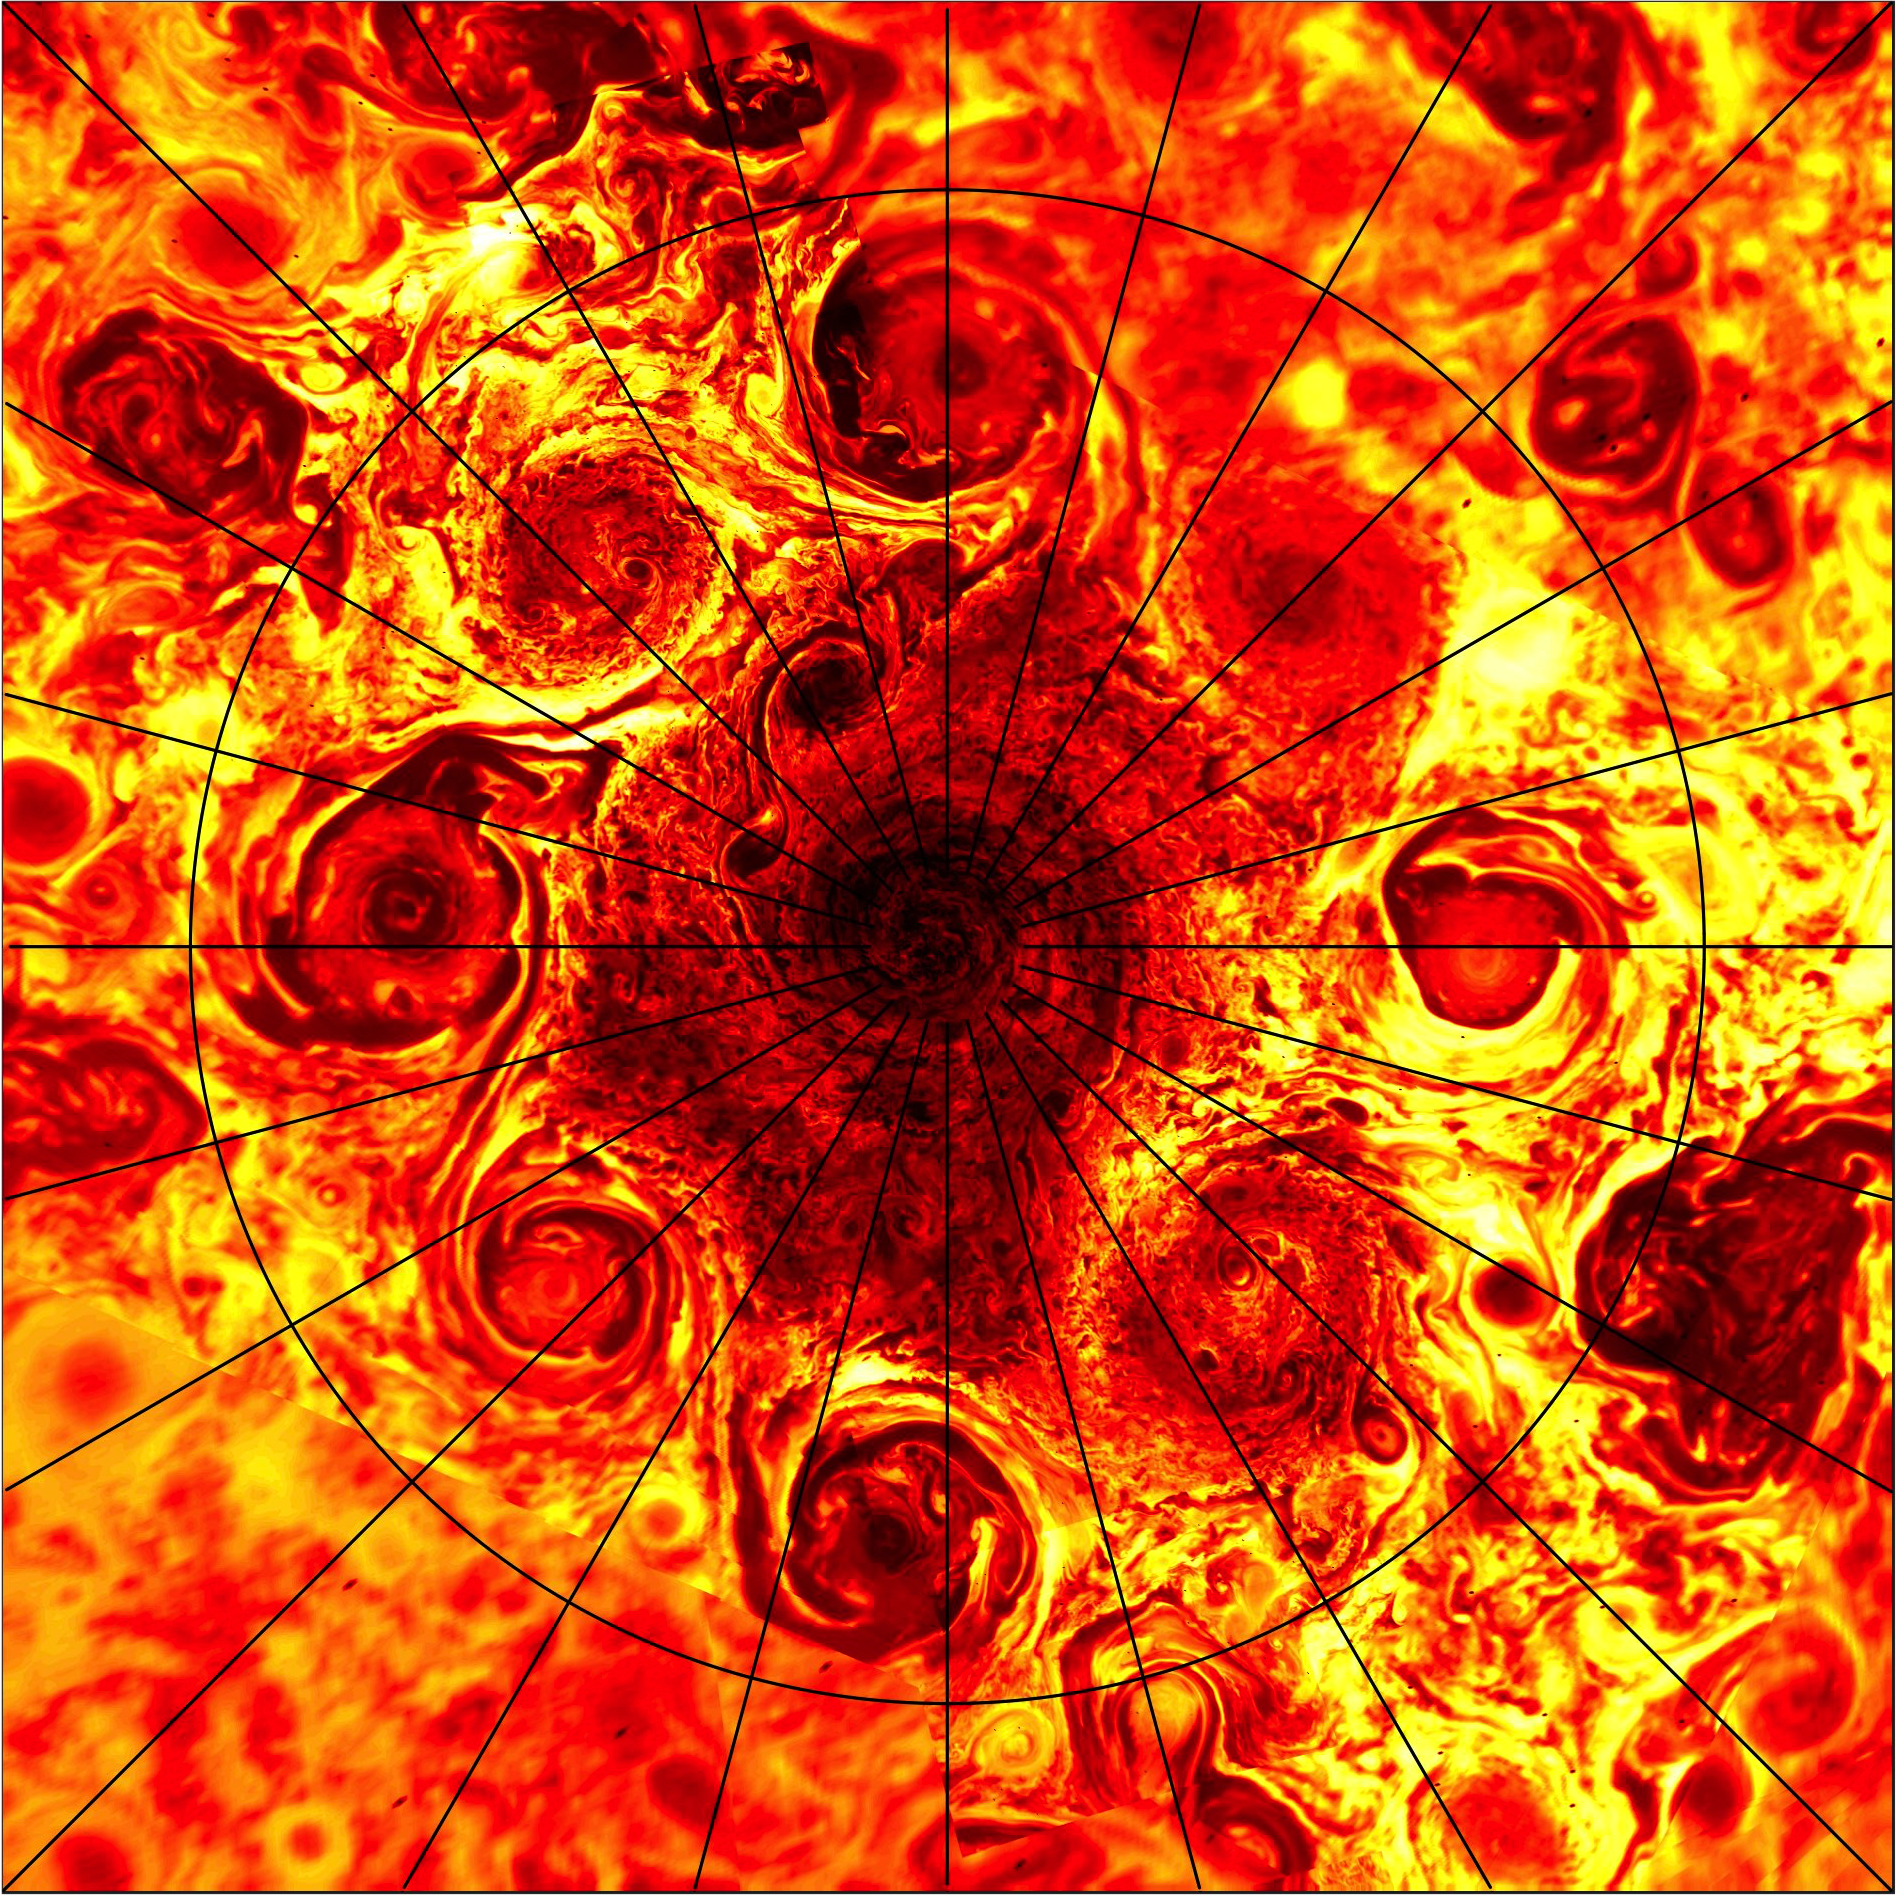
The instrument was designed to map the Jovian aurora, taking advantage of strong methane absorption in the atmosphere, which results in H3+ appearing bright against the dark planet. Combining this IR data with corresponding ultraviolet data from the UVS spectrograph provides a powerful tool for understanding the auroral formation.
The dual capability of JIRAM allows for detailed mapping and probing the atmosphere down to 5-7 bars in an effort to understand convection, lightning formation, distribution of trace atmospheric components and circulation, especially at high latitude.
See Adriani, A. et al., (2017) JIRAM, the Jovian Infrared Auroral Mapper, Space Sci Rev (2017) 213:393 – 446, DOI 10.1007/s11214-014-0094-y for further information.
Measurement Objectives
The analysis of Jupiter's auroras is one of the main scientific objectives for which JIRAM was built. Among the various molecular ions that undergo emission in Jupiter’s aurora only H3+ emits powerfully in the JIRAM spectral range. The JIRAM instrument was designed to investigate the H3+ infrared emission and will be able to furnish spatial, spectral and temporal distribution of the Jovian auroras. Moreover, since limb observations of H3+ emission allow the study of the aurora’s distribution in the thermosphere, JIRAM will be able to essentially map, through the auroral emissions, precipitating energetic electrons trapped in magnetic field lines.
A primary goal of JIRAM is to probe the upper layers of Jupiter's atmosphere down to pressures of 5-7 bars at infrared wavelengths in the 2-5 μm interval using an imager and a spectrometer. JIRAM will sound the Jovian meteorological layer to map moist convection and determine water abundance and other constituents at depths that correspond to several bars of pressure as well as analyze the Jovian hot spots to determine their vertical structure.
The possibility of simultaneously obtaining images, spectra or spectral images due to the presence of the imager and the spectrometer inside JIRAM's optical head, allows great flexibility.
Useful Mission Documents
Mission Description
Spacecraft Description
Mission Timeline (csv)
Instrument Description
Software Interface Specification Document (SIS) - Instrument and data structures description
Spacecraft Description
Mission Timeline (csv)
Instrument Description
Software Interface Specification Document (SIS) - Instrument and data structures description
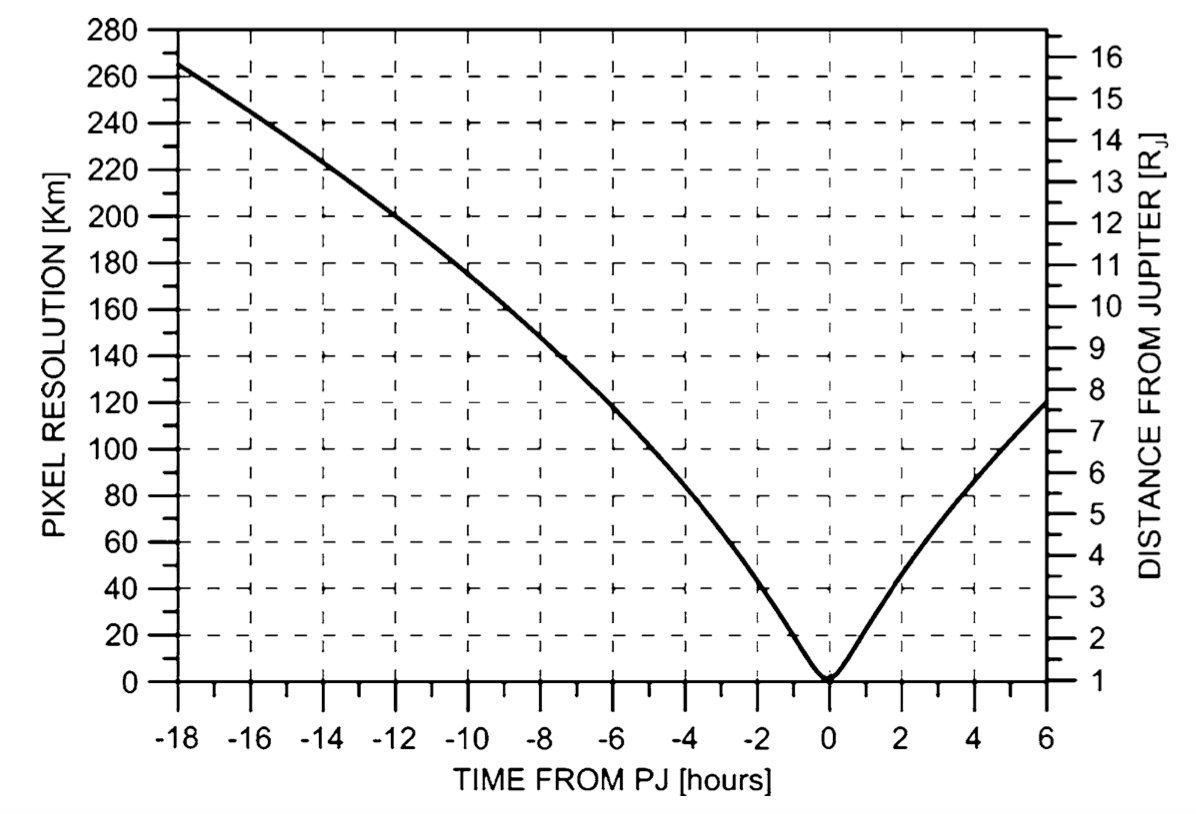
Data acquisition at Jupiter is driven by the goal of obtaining maximum coverage over the planet. Observations are concentrated between 18 hours before and 6 hours after perijove passage. The baseline for JIRAM operations is during those orbits when MWR is the prime instrument. Then the spin axis of the spacecraft is orthogonal to the orbital plane and the JIRAM optical axis is in the orbital plane providing a favorable view of the planet. In addition, limited observations can be obtained during gravity orbits. Throughout the 24-hour period spatial resolution will vary rapidly. The change in resolution during an MWR perijove passage is shown in the following figure for the 1 bar level, ranging from 260km/pixel to nearly 1 km/pixel at closest approach.
Because Juno is a spinning spacecraft and the JIRAM’s despinning mirror can only compensate for a limited time for mechanical reasons, the maximum allowed integration time is 1 sec. In addition, the quality of the measurements can be reduced by environmental radiation.
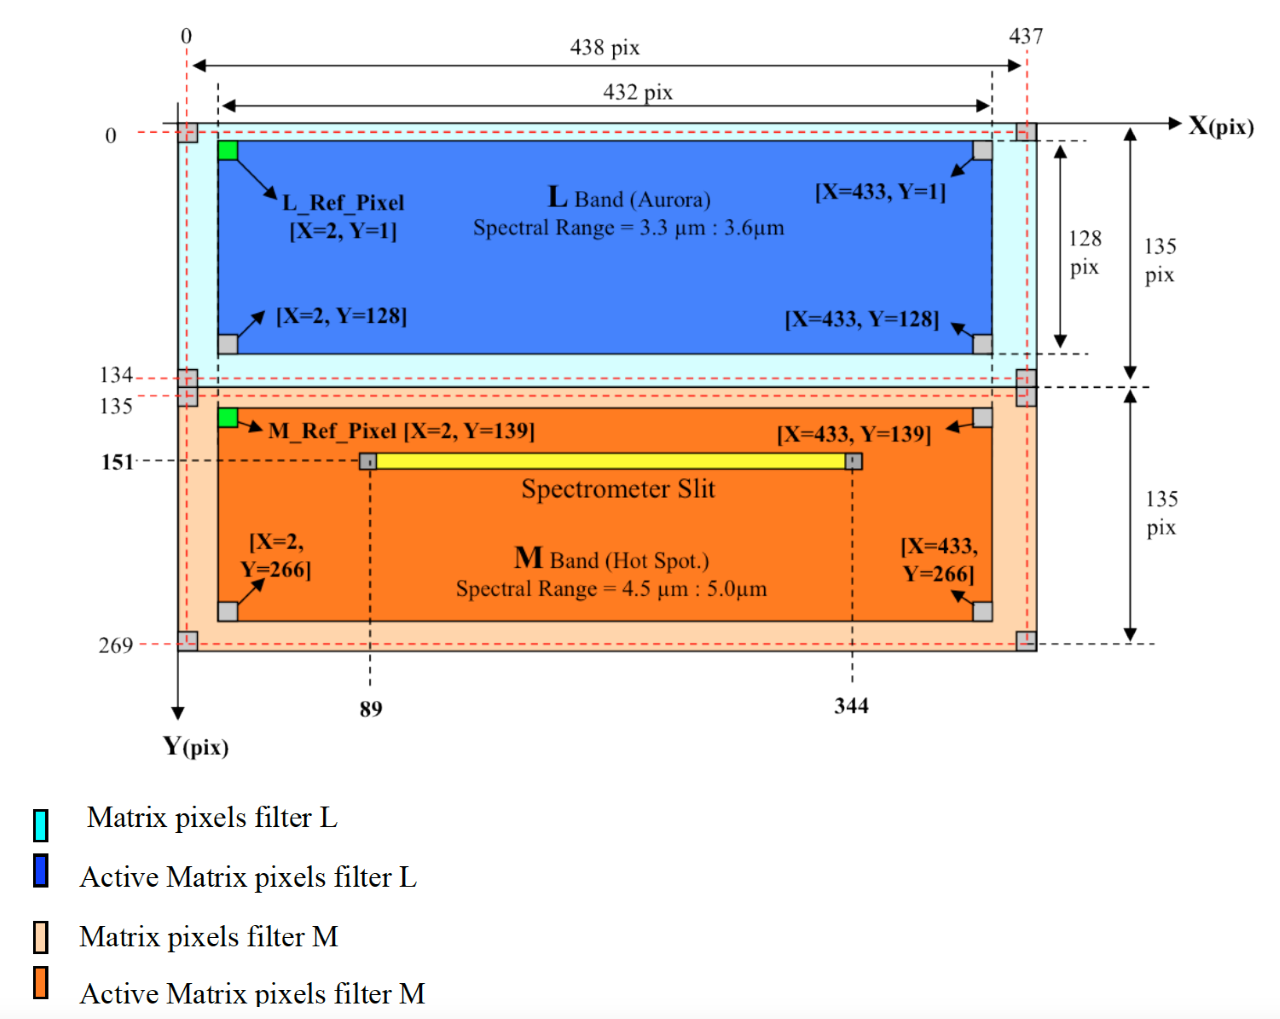
Planned observational sequences involve either a L-band image and simultaneous spectrum for auroral observations or an M-band image and companion spectra for observation of thermal emissions. The organization and size of the data files are determined by the structure of the instrument. The M and L band images are taken on separate portions of the focal plane (each 128 lines by 432 samples). The JIRAM spectrometer focal plane is composed of 256 spatial (lines) and 336 spectral bands (samples). The spectrometer entrance slit is located at line 153 and spans pixels 88 to 343 within the M-band image (D. Grassi, 2017). See the following figure.
The operational modes of the imaging and spectral components are modes summarized in the following table.
| Frame Size Pixels | Data Volume Mbits | |
| Imaging Modes | ||
| I1, Full Images | 256 x 432 | 1.8 |
| I2, M-Band | 128 x 432 | 0.9 |
| I3, L-Band | 128 x 432 | 0.9 |
| Spectral Modes | ||
| S1, High Spatial/High Spectral | 256 x 336 | 1.4 |
| S2, Medium Spatial/High Spectral | 64 x 336 | 0.35 |
| S3, Low Spatial/High Spectral | 16 x 336 | 0.09 |
D. Grassi, et al., Analysis of IR-bright regions of Jupiter in JIRAM-Juno data: Methods and validation of algorithms (2017) Vol 202, 200-209)
Information for experienced users utilizing the SCLK parameter to determine the effective times of exposure. We’ll link the attached file.
Before using JIRAM, data consider checking to ascertain that you are using the latest SPICE files and check for performance reports and indexes
Link to the JIRAM Bundle
Directory containing the RDR data files
Data Set Description
Compressed file of the data (34.9 Gb)
The calibrated 32 bit data consist of files that contain PDS binary TABLE objects for spectral data and binary IMAGE objects for the imaging data. Because this is a modified data set both PDS3 and PDS4 labels are available. The binary files are fixed-length records, stored in most-significant-byte-first (big-endian) format. Planetographic longitude and latitude are utilized and geometry is defined in the IAU 2000 system.
Geometry files - Each table contains geometry data for a time interval of +/-5 hours of perijove in 10 minute intervals. These were generated using WebGeocalc
Perijove table for Primary and Extended Missions
The tables of physical parameters for perijove and north and south pole passage can be used to isolate particular perijove passages, while the JIRAM imaging and spectral indices can be used to isolate time intervals that correspond to desired data.
Physical Parameters for Juno's Orbits (csv)
Performance Reports - These documents describe the activities that JIRAM performed during the perijove passages with particular attention to the comparison of the expected data with that achieved.
Satellite flybys less than 150,000 km for Prime and Extended Missions
Units Correction - All JIRAM RDR image products are in units of band radiance (W/m2/str). Users should note that the labels for RDR image products from Juno orbits PJ1 to PJ26 show data as having units of W/m2/str/micron. The updating of these labels is pending.
The derived JIRAM data bundle consists of maps of Jupiter in CDF format that were obtained during the prime mission and Maps of Ganymede and Io in the extended mission.
4 Jovian Auroral Maps
Map NPJ3 of the northern auroral region during perijove 3 from 2016-08-27T08:24:21 to 2016-08-27T11:51:11.
Map NPJ4 of the northern auroral region during perijove 4 from 2017-02-02T03:59:03 to 2017-02-20T06:56:17.
Map SPJ3 of the southern auroral region during perijove 3 from 2016-08-27T14:54:15 to 2016-08-27T19:51:23
Map SPJ4 of the southern auroral region during perijove 4 from 2017-02-02T15:58:18 to 2017-02-20T18:28:10.
Documentation is available.
An Atmosphere Radiance Map obtained from perijove 2 and 3
The data consists of a map representing radiance (W m^-2 sr^-1) integrated over the wavelength range from 3.3 to 3.6 um. The 1588x2560 matrix extends -179.9297 to 179.9297 longitude and -89.9433 to 89.9433 degrees latitude.
Documentation is available.
A Ganymede Map weighted average depth
The data consists of a 180 X 360 map of the weighted depth of the 2-um band, acquired by JIRAM during orbit 24 spanning the time from 2019-12-26T01:39:21 to 2019-12-26T21:10:56 and representing a longitude grid from 0.5 to 359.5 degrees and from -89.5 to 89.5 degrees.
Documentation is available.
Io Maps of weighted average depth
The dataset consists of weighted average depths at wavelengths of 210, 254, 265, 279, 335, 392, 407, 437, 447, 455 and 462 microns. The maps consist of 180 X 360 matrices representing a grid from 0.5 to 359.5 degrees longitude and -89.5 to 89.5 degrees latitude and span the time interval from 2017-03-27T11:20:31to 2020-04-10T11:25:57 taken during orbits 5, 7, 10, 17, 18, 20, 24 and 26.
Documentation is available.
Directory containing the EDR data files
Data Set Description
During the Earth Flyby JIRAM observed the Moon. Those observations provided a basis for verifying and refining the radiometric calibration of the instrument.
Adriani, A.; Moriconi, M. L.; Mura, A.; Tosi, F.; Sindoni, G.; Noschese, R.; Cicchetti, A.; Filacchione, G., Juno's Earth flyby: the Jovian infrared Auroral Mapper preliminary results, (2016) Astrophysics and Space Science, Volume 361, Issue 8, article id.272, 8 pp.
Main Indices Imaging (csv) or Spectral (CSV) This file summarizes the contents of the raw data archive.
Indices Imaging (csv) or spectral(csv)
Jupiter Data
Calibrated
CITATION_DESC = EDR: Noschese, R. and A. Adriani, JNO-J-JIRAM-2-EDR-V1.0, NASA Planetary Data System, 2017.
Raw data
CITATION_DESC = RDR: Noschese, R. and A. Adriani, JNO-J-JIRAM-3-RDR-V1.0, NASA Planetary Data System, 2017.
CITATION_DESC = EDR: Noschese, R. and A. Adriani, JNO-J-JIRAM-2-EDR-V1.0, NASA Planetary Data System, 2017.
Raw data
CITATION_DESC = RDR: Noschese, R. and A. Adriani, JNO-J-JIRAM-3-RDR-V1.0, NASA Planetary Data System, 2017.
Lunar Data
Calibrated
CITATION_DESC = Adriani, A. and R. Noschese, JUNO JIRAM RDR DATA RECORDS V3.0, JNO-L-JIRAM-3-RDR-V3.0, NASA Planetary Data System, 2016.
Raw data
CITATION_DESC = Adriani, A. and R. Noschese, JUNO JIRAM EDR DATA RECORDS V3.0, JNO-L-JIRAM-2-EDR-V3.0, NASA Planetary Data System, 2016.
CITATION_DESC = Adriani, A. and R. Noschese, JUNO JIRAM RDR DATA RECORDS V3.0, JNO-L-JIRAM-3-RDR-V3.0, NASA Planetary Data System, 2016.
Raw data
CITATION_DESC = Adriani, A. and R. Noschese, JUNO JIRAM EDR DATA RECORDS V3.0, JNO-L-JIRAM-2-EDR-V3.0, NASA Planetary Data System, 2016.
PDS recommendations for citing data sets can be found here.
Adriani, A., R. Noschese, and L. Huber (2019), Juno JIRAM Bundle, PDS Atmospheres (ATM) Node, https://doi.org/10.17189/1518967.
Bibliography - A listing of team members to facilitate literature searches

Privacy / Copyright
Freedom of Information Act
Curator: Lyle Huber
ATM Mgr: Nancy Chanover
Last updated: