
- Address the question of the origin of Jupiter by determining the global O/H ratio (water abundance) in Jupiter's atmosphere
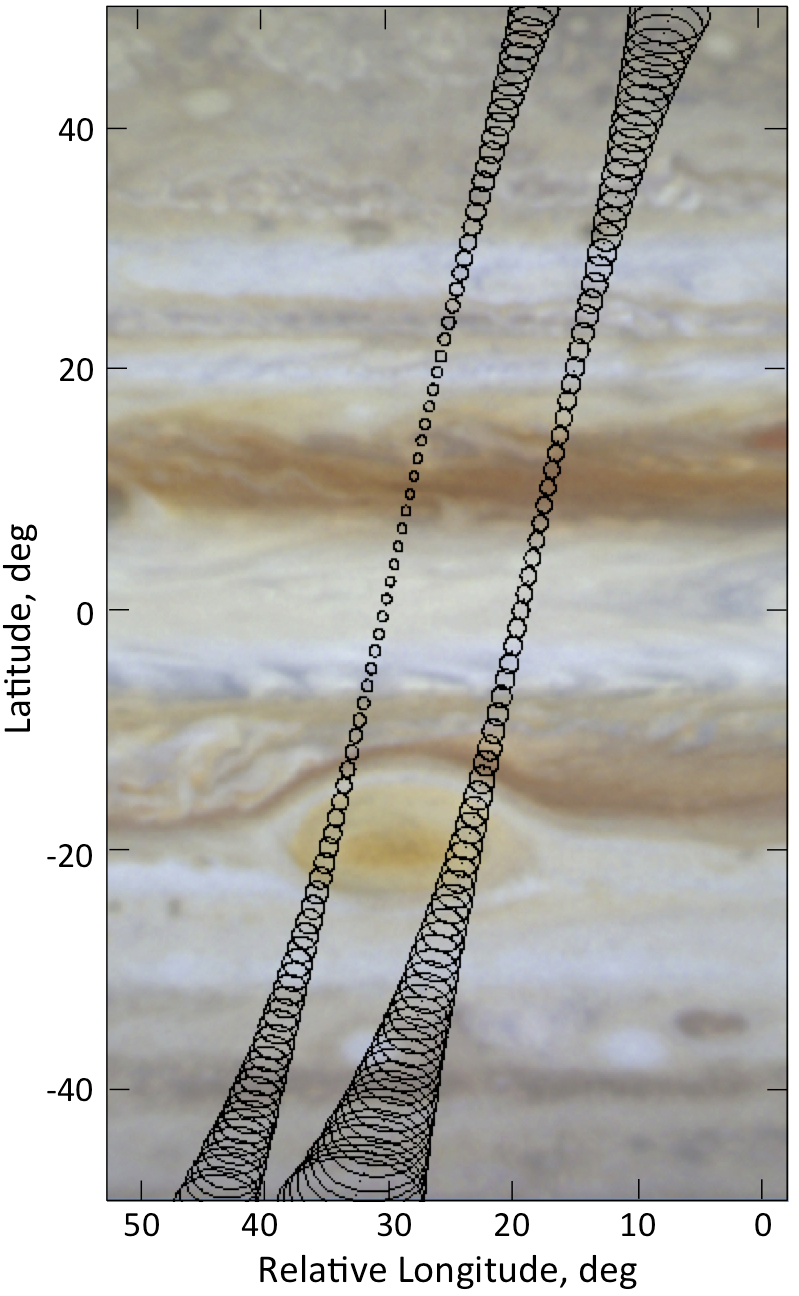
- Study the dynamics of Jupiter’s atmosphere by measuring variations in Jupiter's multi-frequency brightness distribution, inferring composition (ammonia and water) and temperature spatial and temporal distributions.
- Study the radiation belts by measuring the multi-frequency brightness distribution of Jupiter’s non-thermal (e.g., synchrotron) emission from all orbital perspectives.
On this page:
-
Introduction
Jupiter Data
Cruise and Earth Flyby Data
Citing data sets for publication
Bibliography
Spice
Introduction
Instrument Description
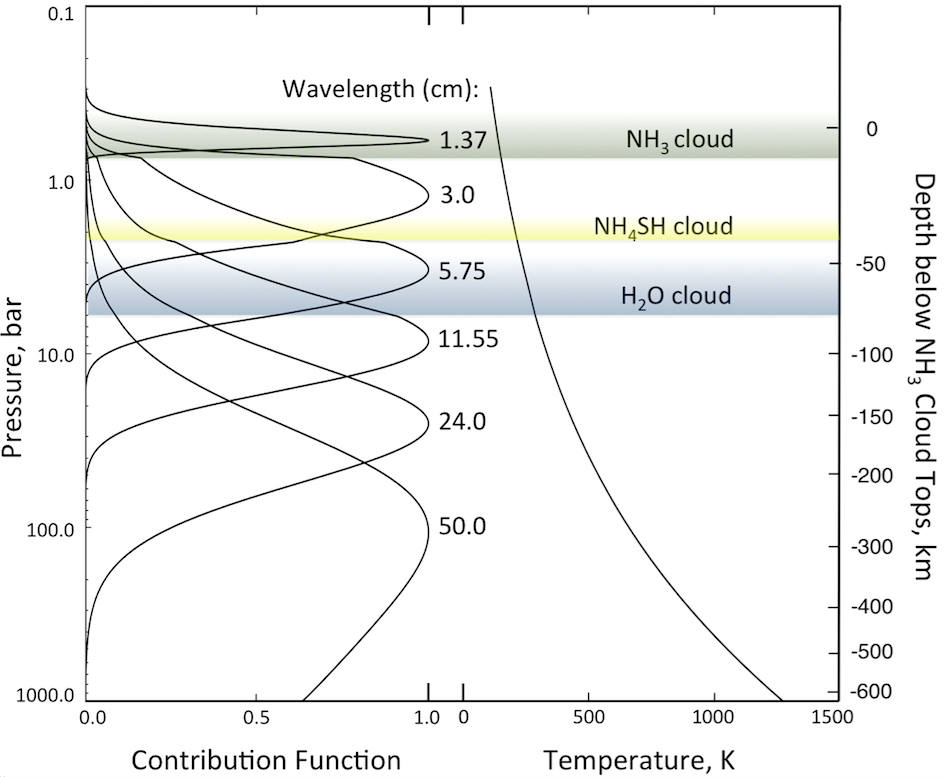
The Juno mission has the overall goal of answering the outstanding questions about Jupiter's origin and structure. The Microwave Radiometer (MWR) contributes to this goal using a microwave sounding approach to explore the spatial and temporal distribution of constituents and temperatures in the atmosphere from the visible cloud level at 0.5 bar to levels approaching 1000 bar. The MWR comprises 6 individual radiometers that measure microwave emission viewed through independent antennas at frequencies distributed from 600 MHz to 22 GHz.
See Janssen, M.A. et al., (2017) MWR: Microwave Radiometer for the Juno Mission to Jupiter, Space Sci Rev (2017) 213:139 – 185, DOI 10.1007/s11214-017-0349-5 for further information.
Measurement Objectives
Mission Description
Spacecraft Description
Mission Timeline (csv)
Instrument Description
Team Personnel
References
Spacecraft Description
Mission Timeline (csv)
Instrument Description
Team Personnel
References
The MWR operates continuously for the mission, turning off only for special events such as JOI. The main reason for this is to ensure stability in the receivers, the calibrations of which are sensitive to thermal transients, especially those induced when turning the instrument off and on again.
Each radiometer measures brightness temperatures of the thermal noise collected by its antenna by averaging this signal over contiguous 100-ms intervals. Data rates are varied by subsampling the ensuing data stream, e.g., every sixth 100-ms integration, for transmission to the ground. The primary atmospheric data are obtained during the short period around perijove, where the full data rate (every 100-ms integration) is achieved. In a typical pass the high data rate is employed beginning 5 hours before perijove and ending 4 hours after, for a total of 9 hours. Much lower data rates (e.g., every 7th integration) are used for the rest of the orbit in order to keep the MWR data volume within its allocation. These data are used primarily for calibration and do not need full sampling.
All data are collected into ASCII files containing an hours worth of data each, beginning and ending on the UT hour, and irrespective of the data rate. Raw (EDR, level 1) files contain uncalibrated data (these are generally of no use to the investigator). The calibrated files (level 2) are of two types: Instrument Reduced Data Records (IRDRs), and Geolocation Data Records GRDRs). These have a one-to-one correspondence with each other as well as with the Raw (EDR) files
Supporting Documentation
Antennae Gain Patterns - Maps of gain(θ,φ) - See Janssen, M.A., Oswald, J.E., Brown, S.T. et al. Space Sci Rev (2017) 213: 139. https://doi.org/10.1007/s11214-017-0349-5 for how the antenna patterns were measured.
Each file contains G which consists of 181 columns (θ=0,...,180) and 360 rows (φ=0,...,359). The pattern is given by 10^(0.1*G).
Antenna 1 (txt) Normalized to 4π Antenna 1 (txt)
Antenna 2 (txt) Normalized to 4π Antenna 2 (txt)
Antenna 3 (txt) Normalized to 4π Antenna 3 (txt)
Antenna 4 (txt) Normalized to 4π Antenna 4 (txt)
Antenna 5 (txt) Normalized to 4π Antenna 5 (txt)
Antenna 6 (txt) Normalized to 4π Antenna 6 (txt)
Link to the PDS4 Bundle
Calibrated Data
Directory containing RDR data files
Data Set Description (pdf)
Data Files
The data are stored in ASCII files, each spanning one-hour of UT time. MWR operates for the entire orbit.
Selecting Data
Derived Data
Derived Data Bundle
Data Description
Data Types There are two data types derived from high-rate data near perijove.
Raw Data This data is not in a form that the general user will find useful
Each radiometer measures brightness temperatures of the thermal noise collected by its antenna by averaging this signal over contiguous 100-ms intervals. Data rates are varied by subsampling the ensuing data stream, e.g., every sixth 100-ms integration, for transmission to the ground. The primary atmospheric data are obtained during the short period around perijove, where the full data rate (every 100-ms integration) is achieved. In a typical pass the high data rate is employed beginning 5 hours before perijove and ending 4 hours after, for a total of 9 hours. Much lower data rates (e.g., every 7th integration) are used for the rest of the orbit in order to keep the MWR data volume within its allocation. These data are used primarily for calibration and do not need full sampling.
All data are collected into ASCII files containing an hours worth of data each, beginning and ending on the UT hour, and irrespective of the data rate. Raw (EDR, level 1) files contain uncalibrated data (these are generally of no use to the investigator). The calibrated files (level 2) are of two types: Instrument Reduced Data Records (IRDRs), and Geolocation Data Records GRDRs). These have a one-to-one correspondence with each other as well as with the Raw (EDR) files
Instrument Description
MWR Theoretical Basis Document and Error Analysis
Microwave Radiometer Flight Software User’s Guide
Instrument User's Guide
Documents - Directory containing the Document Collections
MWR Theoretical Basis Document and Error Analysis
Microwave Radiometer Flight Software User’s Guide
Instrument User's Guide
Documents - Directory containing the Document Collections
Each file contains G which consists of 181 columns (θ=0,...,180) and 360 rows (φ=0,...,359). The pattern is given by 10^(0.1*G).
Antenna 1 (txt) Normalized to 4π Antenna 1 (txt)
Antenna 2 (txt) Normalized to 4π Antenna 2 (txt)
Antenna 3 (txt) Normalized to 4π Antenna 3 (txt)
Antenna 4 (txt) Normalized to 4π Antenna 4 (txt)
Antenna 5 (txt) Normalized to 4π Antenna 5 (txt)
Antenna 6 (txt) Normalized to 4π Antenna 6 (txt)
Link to the PDS4 Bundle
Data Set Description (pdf)
Data Files
The data are stored in ASCII files, each spanning one-hour of UT time. MWR operates for the entire orbit.
A basic data unit for this migrated data consists of two comma-separated tables [Instrument Reduced Data Records (IRDR) and associated Geometry Reduced Data Records (GRDR)] and their corresponding PDS3 and PDS4 labels. Utilizing the appropriate Mission Time and MWR Indices will allow you to enter start and stop times to retrieve the desired data.
The MWR geometry files span a period of +/- 5 hours of perijove and list physical parameters for 10-minute intervals. The parameters include apparent angular size of Jupiter, planetographic latitude and longitude, planetary radius and the observer distance of the subspacecraft point as well as subsolar planetographic longitude and latitude and phase angle.
Geometry files - Each table contains geometry data for a time interval of +/-5 hours of perijove in 10 minute intervals. These were generated using WebGeocalc
Perijove table for Primary and Extended Missions
The tables of physical parameters for perijove and north and south pole passage can be used to isolate particular perijove passages, while an MWR index for a selected passage can be used to isolate time intervals that correspond to desired data.
Physical Parameters for Juno's Orbits
Reduced Data
Main Index (csv) This file summarizes the contents of the calibrated data archive. It lists URN, start and stop times and the file size. Times of perijove are tagged.
Selecting Data at the file level
The MWR geometry files span a period of +/- 5 hours of perijove and list physical parameters for 10-minute intervals. The parameters include apparent angular size of Jupiter, planetographic latitude and longitude, planetary radius and the observer distance of the subspacecraft point as well as subsolar planetographic longitude and latitude and phase angle.
Geometry files - Each table contains geometry data for a time interval of +/-5 hours of perijove in 10 minute intervals. These were generated using WebGeocalc
Perijove table for Primary and Extended Missions
The tables of physical parameters for perijove and north and south pole passage can be used to isolate particular perijove passages, while an MWR index for a selected passage can be used to isolate time intervals that correspond to desired data.
Physical Parameters for Juno's Orbits
Derived Data Bundle
Data Description
Data Types There are two data types derived from high-rate data near perijove.
Antenna Temp., Synchrotron Emission and Atmospheric Brightness Temp tabulated as csv files for each orbit.
Water Distribution and Ammonia Distribution datasets comprised of 2 csv files distinguished as H2OA (abundance) and H2OU (uncertainty) and NH3A (abundance) and NH3U (uncertainty).
Water Distribution and Ammonia Distribution datasets comprised of 2 csv files distinguished as H2OA (abundance) and H2OU (uncertainty) and NH3A (abundance) and NH3U (uncertainty).
Directory containing the EDR data files
Data Set Description (txt)
Data Files
Index (csv)
Selecting Data at the file level
Data Set Description (txt)
Data Files
Index (csv)
Selecting Data at the file level
Steffes, P.G. et al., (2017) High - Precision Laboratory Measurements Supporting Retrieval of Water Vapor, Gaseous Ammonia, and Aqueous Ammonia Clouds with the Juno Microwave Radiometer (MWR), Space Sci Rev (2017) 213:187–204, DOI 10.1007/s11214-016-0265-0.
1. Bellotti A., P.G. Steffes, and G. Chinsomboon “Laboratory Measurements of the 5-20 cm Wavelength Opacity of Ammonia, Water Vapor, and Methane under Simulated conditions for the Deep Jovian Atmosphere,” Icarus, vol. 280, pp. 255-267, December 2016. ( doi: 10.1016/j.icarus.2016.07.013.)
Bellotti A., P.G. Steffes, and G. Chinsomboon “Corrigendum to ‘Laboratory Measurements of the 5-20 cm Wavelength Opacity of Ammonia, Water Vapor, and Methane under Simulated conditions for the Deep Jovian Atmosphere’ [Icarus 280 (2016) 255-267]” Icarus, vol. 284, pp. 491-492, March 2017. (doi: 10.1016/j.icarus.2016.11.006.)
2. K. Devaraj, P.G. Steffes, and D. Duong, "The Centimeter-Wavelength Opacity of Ammonia under Deep Jovian Conditions," Icarus, vol. 241, pp. 165-179, October 2014.
3. T. R. Hanley, P.G. Steffes, and B.M. Karpowicz, “A New Model of the Hydrogen and Helium-Broadened Microwave Opacity of Ammonia Based on Extensive Laboratory Measurements,” Icarus, vol. 202, pp. 316-335, July 2009.
1. Bellotti A., P.G. Steffes, and G. Chinsomboon “Laboratory Measurements of the 5-20 cm Wavelength Opacity of Ammonia, Water Vapor, and Methane under Simulated conditions for the Deep Jovian Atmosphere,” Icarus, vol. 280, pp. 255-267, December 2016. ( doi: 10.1016/j.icarus.2016.07.013.)
2. B.M. Karpowicz and P.G. Steffes, “In Search of Water Vapor on Jupiter: Laboratory Measurements of the Microwave Properties of Water Vapor under Simulated Jovian Conditions," Icarus, vol. 212, pp. 210-223, March 2011.
B.M. Karpowicz and P.G. Steffes, “Corrigendum to ‘In Search of Water Vapor on Jupiter: Laboratory Measurements of the Microwave Properties of Water Vapor under Simulated Jovian Conditions’[Icarus 212 (2011) 210-223],"Icarus, vol. 214, p. 783, August 2011.
1. D. Duong, P.G. Steffes, and S. Noorizadeh, “The Microwave Properties of the Jovian Clouds: A New Model for the Complex Dielectric Constant of Aqueous Ammonia,” Icarus, vol. 229, pp. 121-130, February 2014.
GENERAL INFORMATION
1. P.G. Steffes, T.R. Hanley, B.M. Karpowicz, K. Devaraj, S. Noorizadeh, D. Duong, G. Chinsomboon, A. Bellotti, M.A. Janssen, and S.J. Bolton, “High-Precision Laboratory Measurements Supporting Retrieval of Water Vapor, Gaseous Ammonia, and Aqueous Ammonia Clouds with the JUNO Microwave Radiometer (MWR),” Space Science Reviews, vol. 213, no.1-4, pp. 187-204, November 2017. (doi:10.1007/s11214-016-0265-0) .
2. Janssen, M.A., J.E. Oswald, S.T. Brown, S. Gulkis, S.M. Levin, S.J. Bolton, , M.D. Allison, , S.K. Atreya, D. Gautier, , A.P. Ingersoll, J.I. Lunine, G.S. Orton, T. Owen, P.G. Steffes, V. Adumitroaie, A. Bellotti, L. A. Jewell, C. Li, L. Li, S. Misra, F.A. Oyafuso, D. Santos-Costa, E. Sarkissian, R. Williamson, J.K. Arballo, A. Kitiyakara, A. Ulloa-Severino, J.C. Chen, F.W. Maiwald, A.S. Sahakian, P.J. Pingree, K.A. Lee, A.S. Mazer, R. Redick,
R.E. Hodges, R.C. Hughes, , G. Bedrosian, D.E. Dawson, W.A. Hatch, D.S. Russel, N.F. Chamberlain, M.S. Zawadski, B. Khayatian, B.R. Franklin, H.A. Conley, J.G. Kempenaar, M.S. Loo, E.T. Sunada, V.P. Vorperion, C.C. Wang, “MWR: Microwave Radiometer for the Juno Mission to Jupiter,” Space Science Reviews, vol 213, no. 1-4, pp. 139-185, November 2017 (doi:10.1007/s11214-017-0349-5)
Instrument User’s Guide
Software Interface Specification (SIS) Instrument and data structures description
Calibration Document – Description of calibration methods
Flight Software User's Guide
Calibrated Data - Directory containing the RDR data files
Data Set Description
Raw Data - Directory containing the EDR data files
Data Set Description
Selecting Data - Access the resources provided above in Calibrated Data to determine start and stop times
Jupiter Data
PDS4 Bundle
M.A. Janssen (2017), Juno MWR Bundle, NASA Planetary Data System, https://doi.org/10.17189/1518928.
Calibrated
M.A. Janssen (2017), JUNO JUPITER MWR REDUCED DATA RECORDS V1.0, JNO-J-MWR-3-RDR-V1.0, NASA Planetary Data System, https://doi.org/10.17189/nwwz-eg56.
Raw
M.A. Janssen (2017), JUNO JUPITER MWR EXPERIMENT DATA RECORDS V1.0, JNO-J-MWR-2-EDR-V1.0, NASA Planetary Data System, https://doi.org/10.17189/jsyx-pk38.
Cruise Data
Calibrated
M.A. Janssen (2016), JUNO MWR CRUISE/SKY RDR DATA RECORDS V2.1, JNO-X-MWR-3-RDR-V2.1, NASA Planetary Data System, https://doi.org/10.17189/3hzx-jv21.
Raw
M.A. Janssen (2016), JUNO MWR CRUISE/SKY EDR DATA RECORDS V2.1, JNO-X-MWR-3-RDR-V2.1, NASA Planetary Data System, https://doi.org/10.17189/yb07-p811.